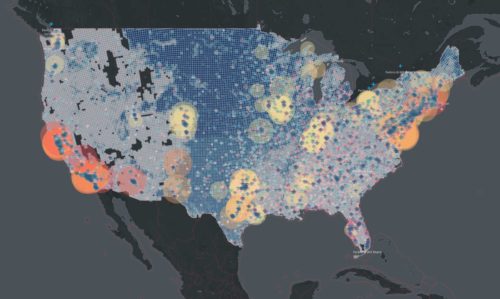
How do we track and understand how people use spaces of different uses and scales at different times? The traditional ways of gathering this data and information have been observation and survey. From William Holly Whyte’s camera studies of public space to Louis Kahn’s Philadelphia planning study (pictured above), architects and planners have relied on observation to drive their understanding and ideation for spatial layouts. The U.S. Census is the gold-standard of demographic data on the entire population of America, and it is administered largely via survey. Even today, many institutes in the political, sociological and design realms rely heavily on these methods to create strategies or analyses on behavior and sentiment as well as predictions of outcomes. There are obvious challenges with this methodology (see 2016 U.S. election predictions) and they are rooted in the relatively low response/sampling rates of all surveys, as well as the limitations of the traditional scientific method. While individual studies can advance the incremental development of theories in aggregate, they require careful study and validation in order to rely on their own findings. Up until now, it has been impossible to surpass the flexibility and fidelity of these methods for complex qualitative data-gathering, and there have been zero options for studying entire populations and real-time environmental conditions. However, the new wireless information grid of the world and the networked cloud infrastructure of the internet unlock dramatic new possibilities for information gathering of both quantitative and qualitative metrics.
Methods of information and data gathering
When we consider data about users and spaces there are two main measures to consider; the quantitative and the qualitative. Often observational data is concerned with counting and logging users and activities in time and space. How many people of what kind–”who”–are at a given location–”where”–at a certain time–”when”? Beyond the quantitative and temporal data recorded during observation, there are also the qualitative measures of “what” users are doing and “how” the space and users perform during activities. Then there is the most complex question of all–”why”–which gets to the root of people’s behavior and experience. Observation often requires a degree of expertise or ability which scales with the complexity of the phenomena under study. Almost anyone can count or evaluate basic behaviors; it takes real experts to extract higher-level insights. Deploying experts to study conditions over long periods of time is an expensive endeavor and sometimes impossible due to a lack of human capital. Sometimes basic observational data is taken as a whole and analyzed by experts to “extract” likely conclusions via induction or deduction.
The other main method used to study spatial interaction is survey. The ideal surveys would use expert sociologists to administer clinical-level questions on individuals selected by sample and record observational data or neurophysical response to ascribe confidence levels to the individual question results. In reality, most surveys are actually distributed via digital communication channels and have uneven or unpredictable response. With the new ease of deployment they often take the place of costly observation studies as well, choosing to ask users to self-evaluate and ascribe values to temporal events or behaviors. Intercept surveys or micro-polls begin to overcome these deficiencies by engaging users in brief sessions at the time of activity to log qualitative responses to specific spatial/temporal interactions. However, this re-introduces the human resource challenges of observation-based studies. Even without experts, these methods of data capture are time consuming and expensive. Within this existing framework, there are now new opportunities to employ technology and overcome the previous challenges outlined.
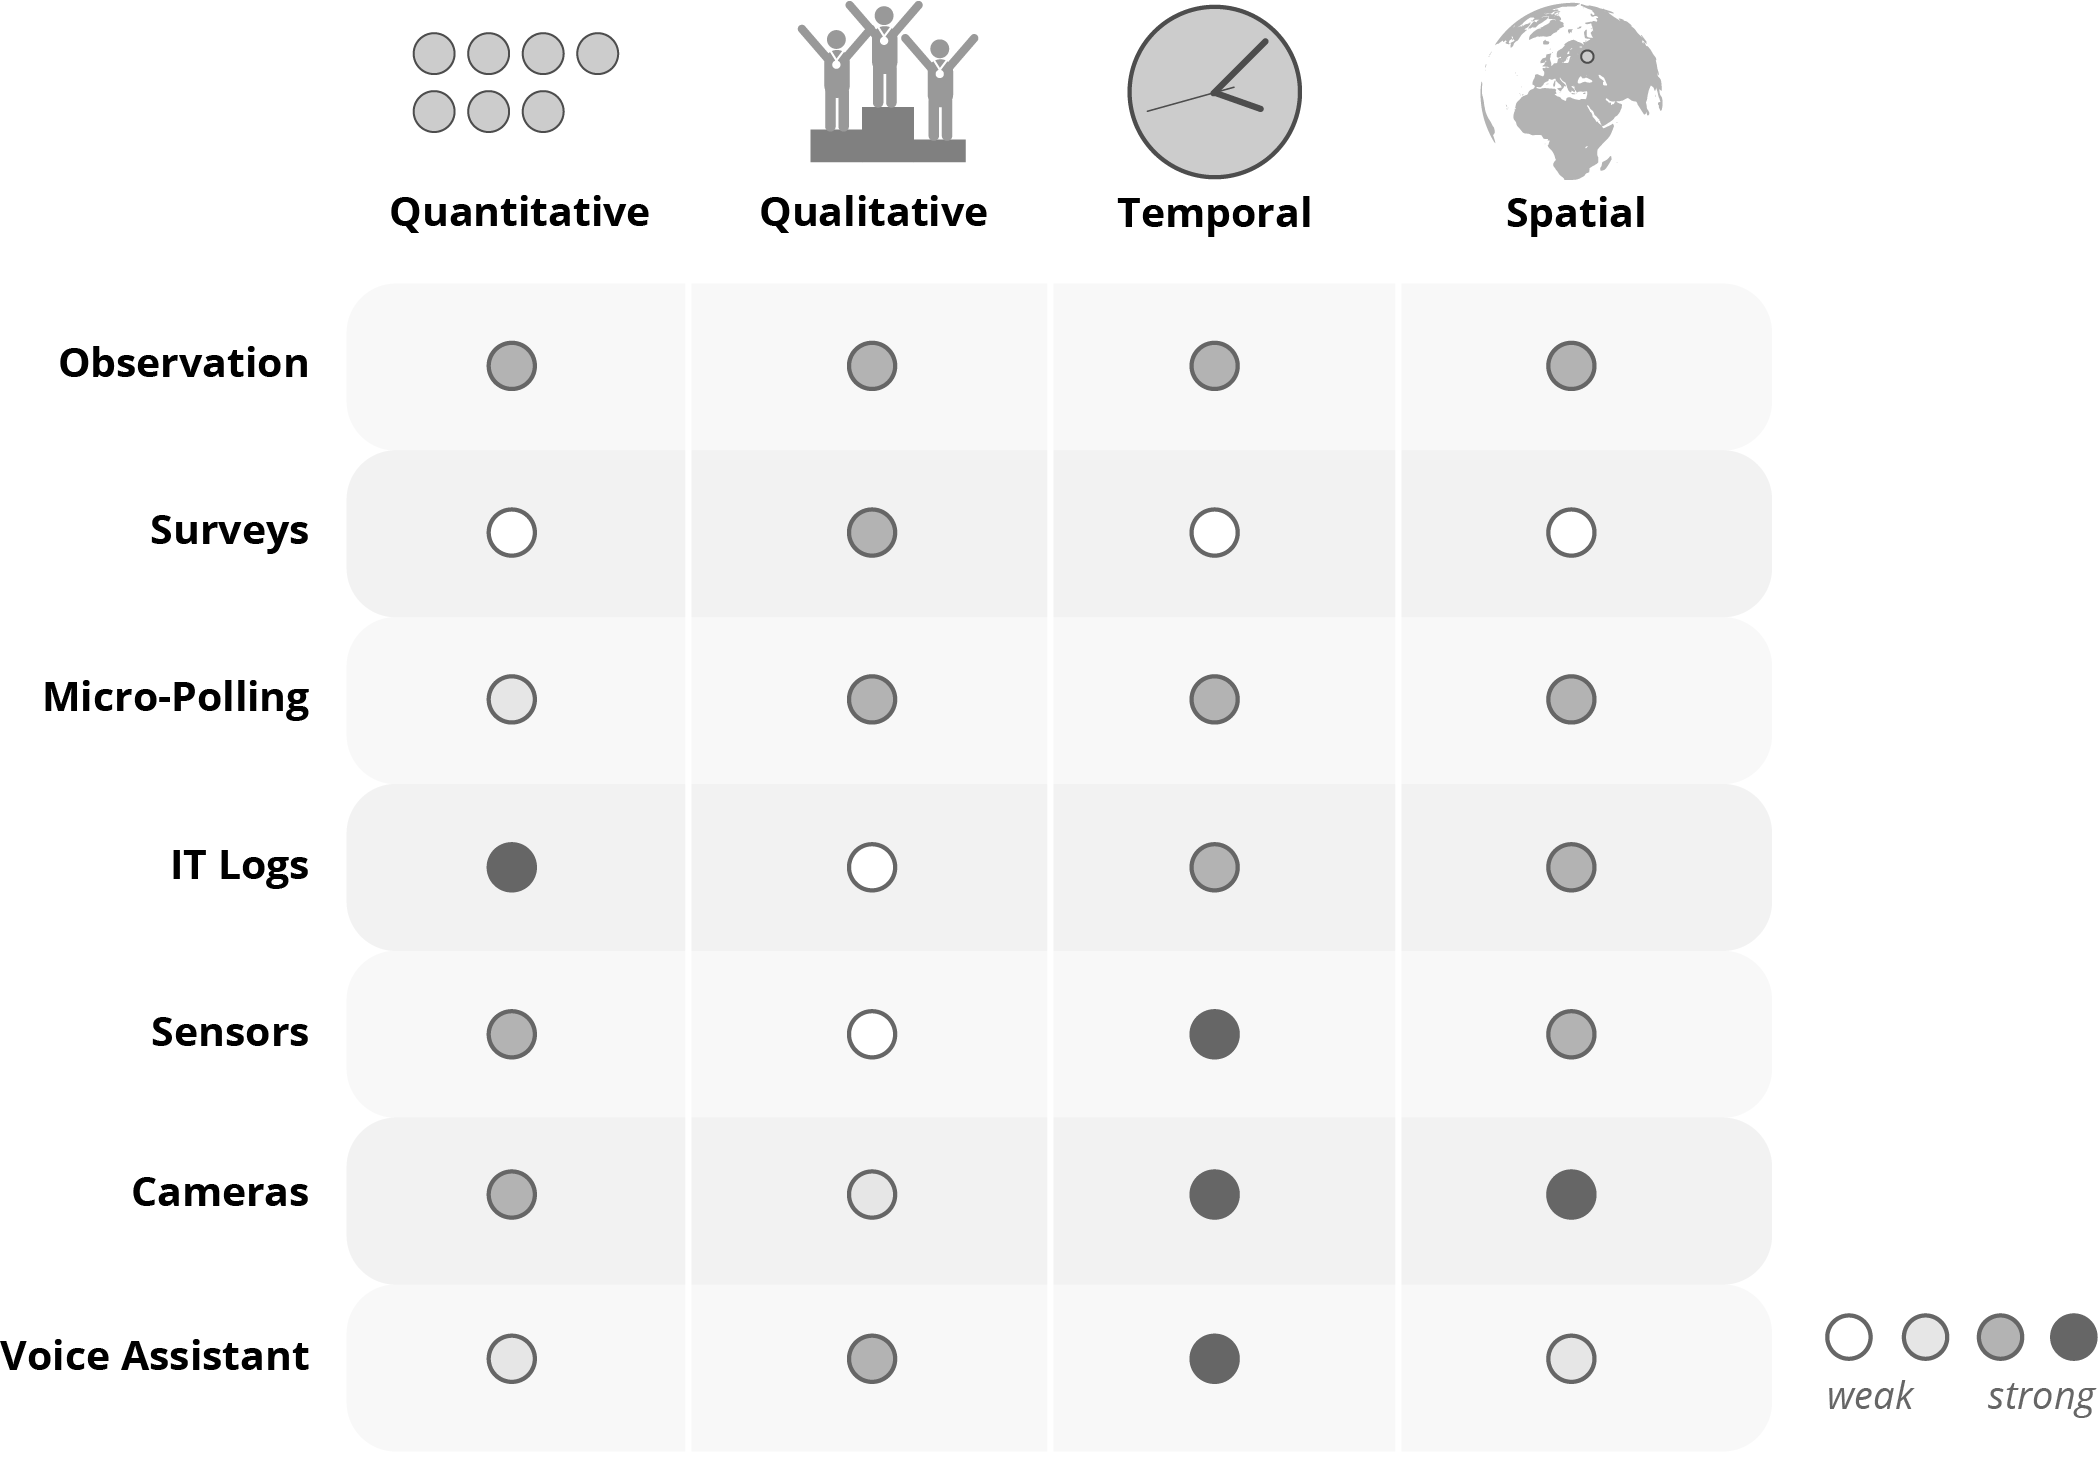
The table below highlights the strengths and weaknesses of different methods. We have added the following items to the methods described above; IT (Information Technology) Logs, Sensors, Cameras and Voice Assistants. We will be unpacking voice assistants and sensors below, while cameras and IT logs are linked to separate articles. Here are brief summaries of each of these methods.
IT Logs
Wired and wireless internet connections, enterprise applications, email and VOIP communications and other devices generate timestamped logs of data which can be mined for insight.
Sensors
Wifi connected sensors can transmit real-time data about environmental conditions (such as light, temperature, sound) and register button presses and other responsive interface interactions.
Cameras
Cameras with cloud connectivity can run AI algorithms which are capable of counting people and objects, as well as potential abilities to "read" complex qualitative actions in the field of view.
Voice Assistance
Voice assistants such as Amazon Alexa or custom chatbots can be used to directly interact with users in space based on pre-defined triggers and without requiring direct human capital for surveying.
Gathering user input without an app
Looking at the table above, it is tempting to think about a smartphone app as the perfect solution to combine the best elements of many of these methods. After all, modern smartphones are laden with sensors, cameras, plenty of computation ability to drive voice assistants and a rich app infrastructure which makes content delivery and user interface seamless. There have been many attempts to capture spatial user information from custom apps. The reality however, the mobile application paradigm involves apps providing services. Uber gives drivers and passengers a platform to connect for ad-hoc ride shares and driving services. The application collects lots of positional and time-based data, but that is as a byproduct of the core service offering. People are not used to applications which only require them to participate in providing information without a service in return. While there is an implicit contract implied in user feedback (comments, suggestion boxes, surveys, etc.), it is often difficult to engage users solely for this purpose when it is on their personal devices.
The advantage of a mobile app is that there is local compute power and network connectivity right on the device, as well as portable power as the user is constantly recharging the device. The major downside is getting people to install and use such an app, as well as development concerns around maintenance, privacy and battery consumption. Increasingly we view the future of this space as “edge” devices where sensors, web connections, compute and user interaction take place on a stand-alone device which isn’t tied to a specific user.
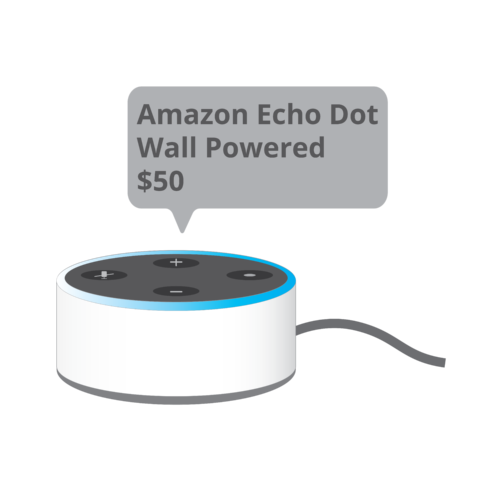
Tapping into natural voice interactions
People today are supremely comfortable with mobile smartphone and tablet devices. This means that the user does not need to be trained on most basic UI elements (like the touchscreen, gestures, social-media sharing, etc.) One of the ways we can disengage the mobile device without forcing users to learn a whole new service is to rely on natural language processing and voice interaction. Using cloud services such as the Amazon Echo platform allows us to leverage low cost devices which can be programmed and reprogrammed remotely with customizable and complex interactions.
Each one of these devices costs less than $50 USD when purchased at scale. They can be distributed easily and it only takes one pre-configured smart device–such as a tablet or smartphone–to connect them to wifi. Once they are configured, they can be moved easily within the same location and re-placed by a simple user command. They can listen and respond to anyone without any customized training. Interaction cues can be distributed to an organization via emails or described locally on a placard. There is no app and perfect anonymity.
Surveying users at a specific place allows for high-level contextual questions about what is taking place there at that specific time, without requesting personal information or forcing users to download an app. While there are other technologies which can be used to mine information from spaces, it might be that the simplest way to learn is to ask.
Social meets spatial
Once we are able to generate activity information that is tied to each room, the next step becomes to spatialize it to visualize and represent this data in three dimensions. The embedded viewer below allows for interactive filtering and display of different variables.
This is an example data visualization of meeting space utilization in the Perkins + Will Chicago office. All formal and informal meeting spaces across 5 floors of the Wrigley Building are visualized here. Different meeting room datapoints are offered for analysis. Readings from cameras, sensors, and mining IT systems could yield data points to generate meeting typology insight. Some values are fixed (such as room capacity) while others can yield information as to which types of spaces are used for various activities such as collaboration and presentation with different audiences (internal or external). Note: all the data is simulated
Data Filtering
Value Mapped:
Floor:
Plan View
Map Interactions:
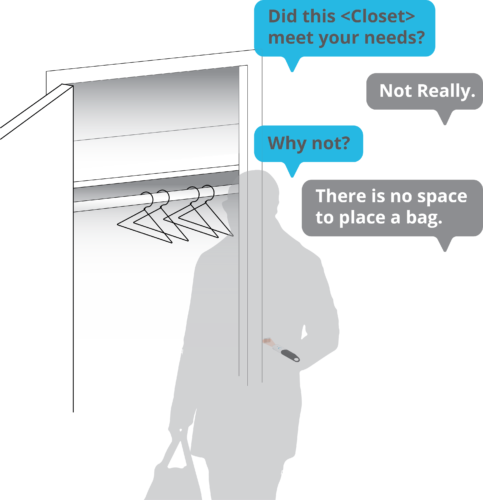
Asset utilization with "scouts"
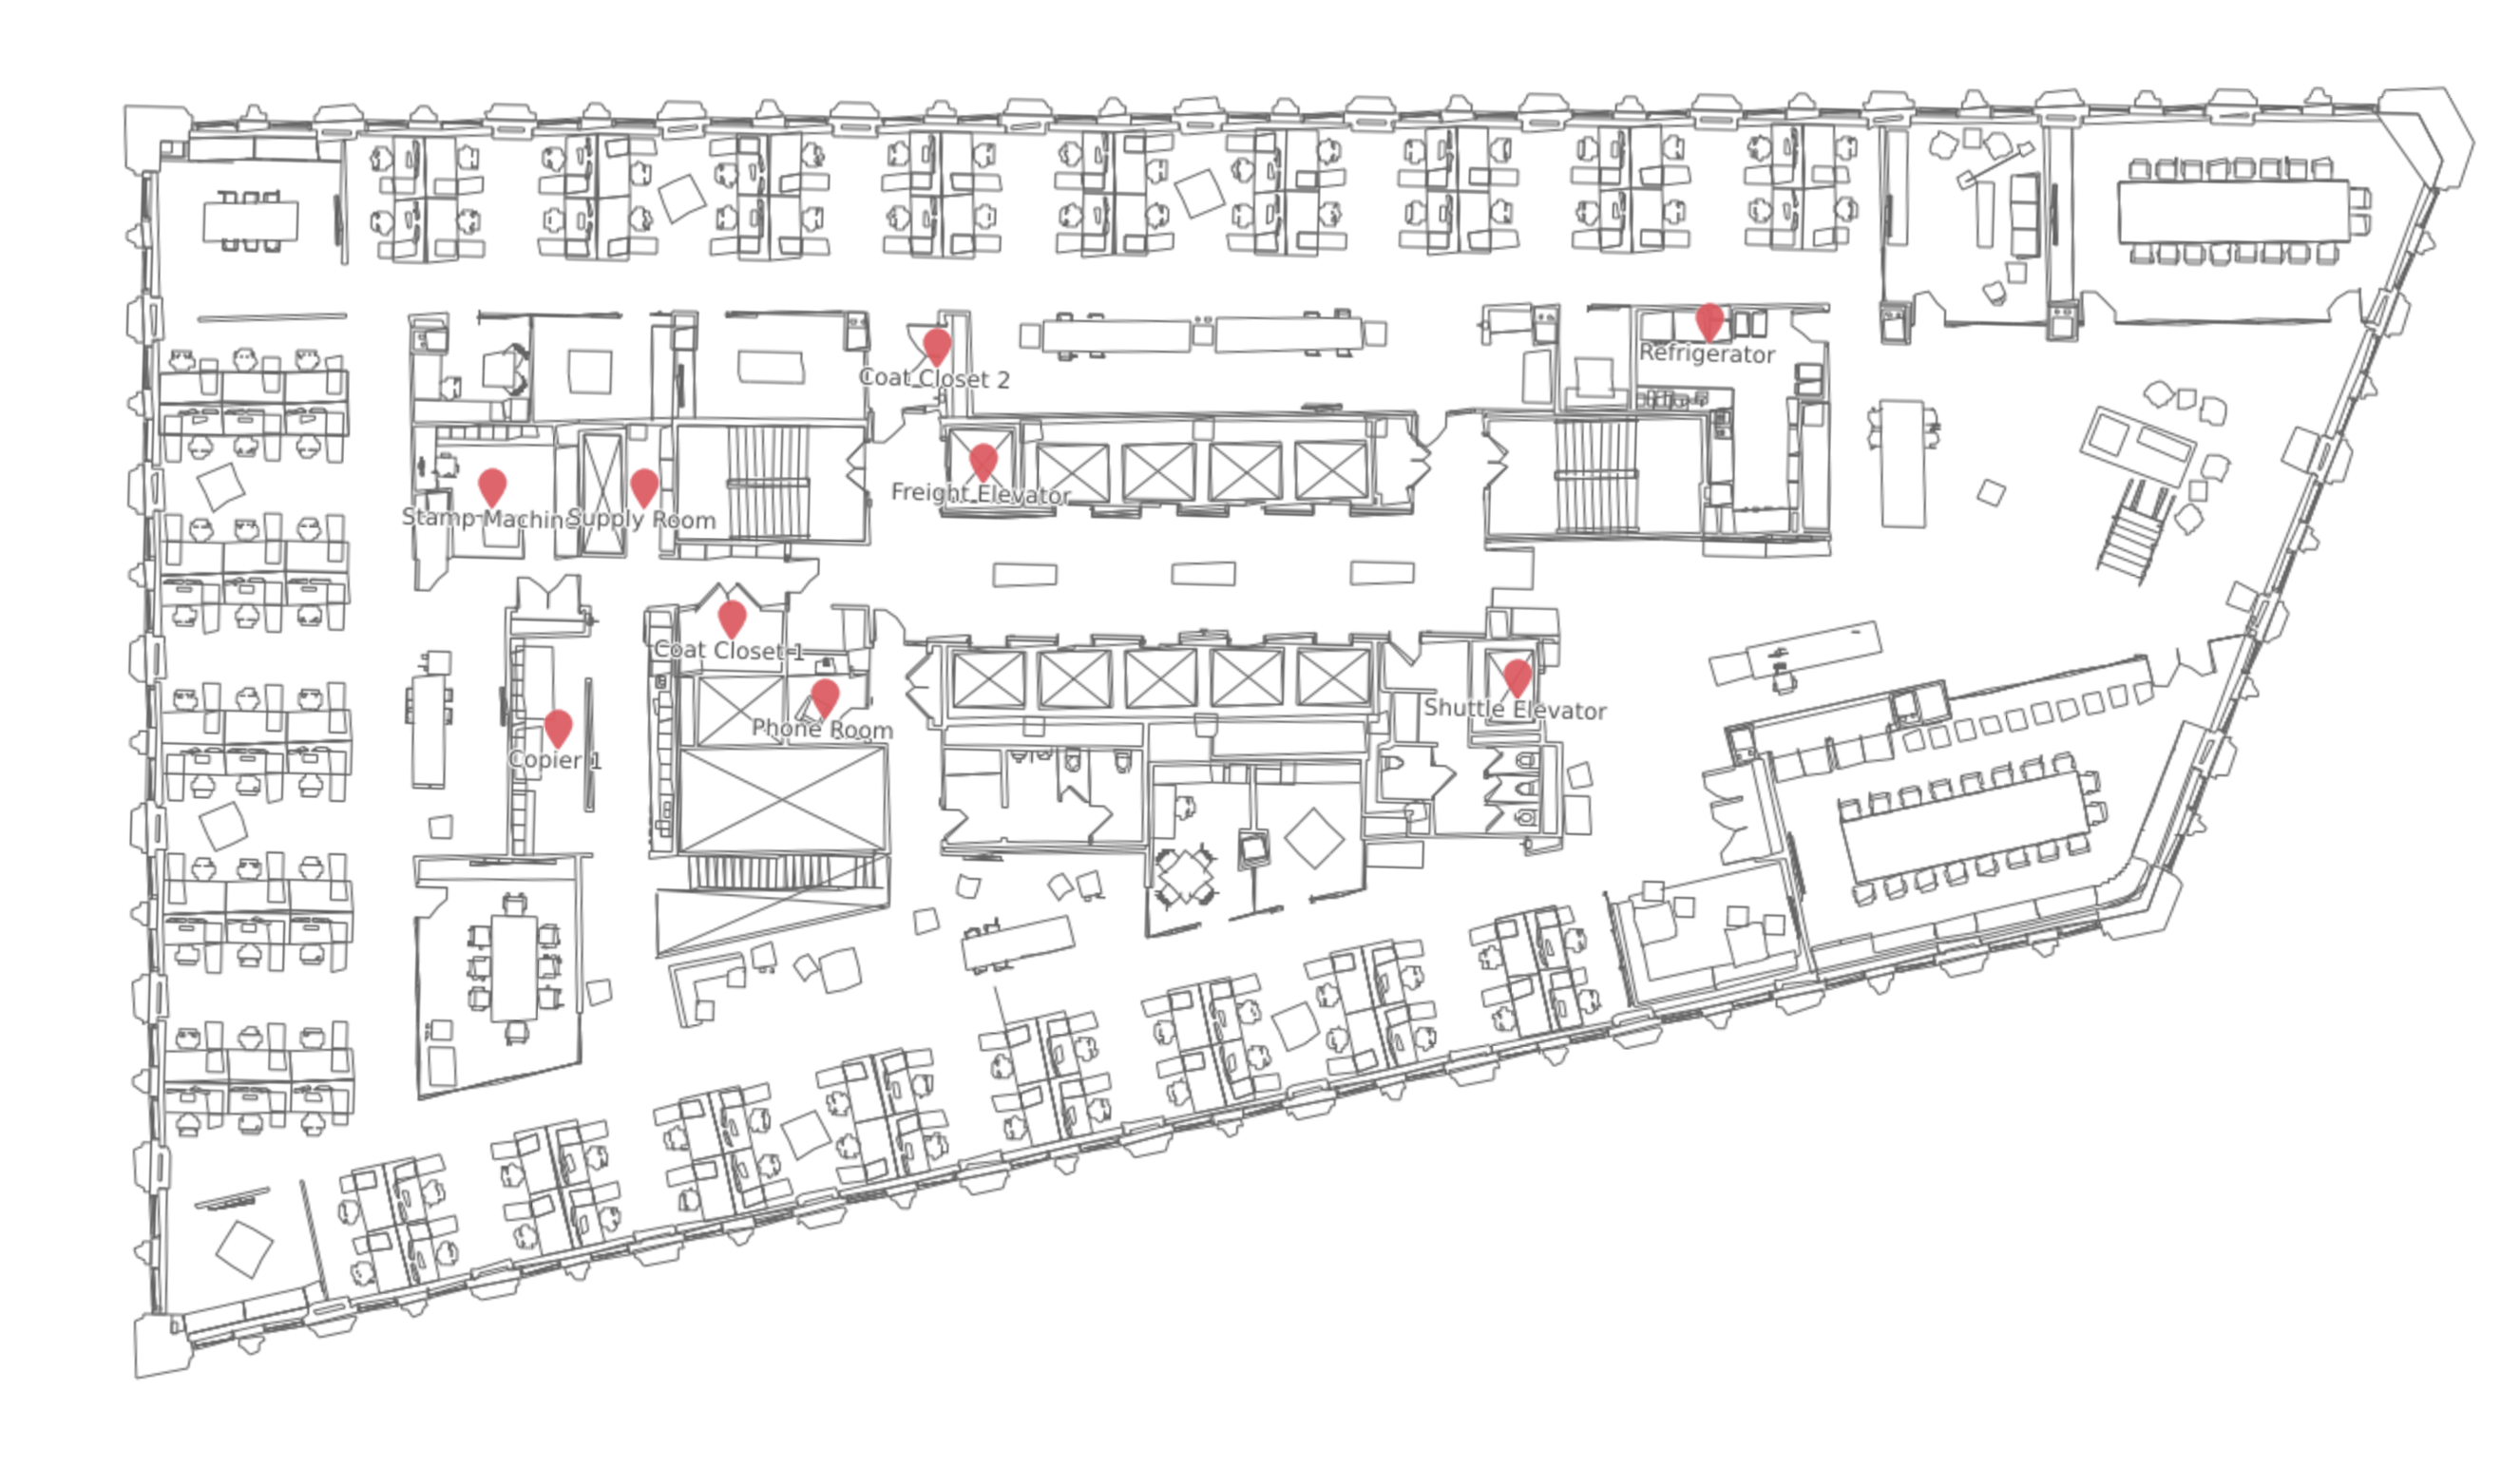
There are also even more portable versions of the echo. The dash wand incorporates a lightweight version of the Alexa platform capable of recording interactions on the go. While it does not register the place by default, it does include a bar-code scanner. While this functionality is still restricted to scanning consumer items to add them to your Amazon shopping cart, an open version of this technology can be used to performing utilization studies. Custom bar codes can easily be printed on stickers and distributed around a space. Users with the wand can scan the local tags which could be attached to support spaces or vending machines. In the floorplan above, the points represent various spatial elements such as the internal elevator, coat closets, pantries and the phone room. Imagine tasking a number of users as scouts to register when they use these spaces and ask targeted questions via vocal interaction. For example: a scout scans the bar code at the coat closet and is asked whether there is room for their items or enough hangers. While this technique is more flexible than having location specific devices, it also requires more user support so it is not ideal for all users of a space-hence the scouts.

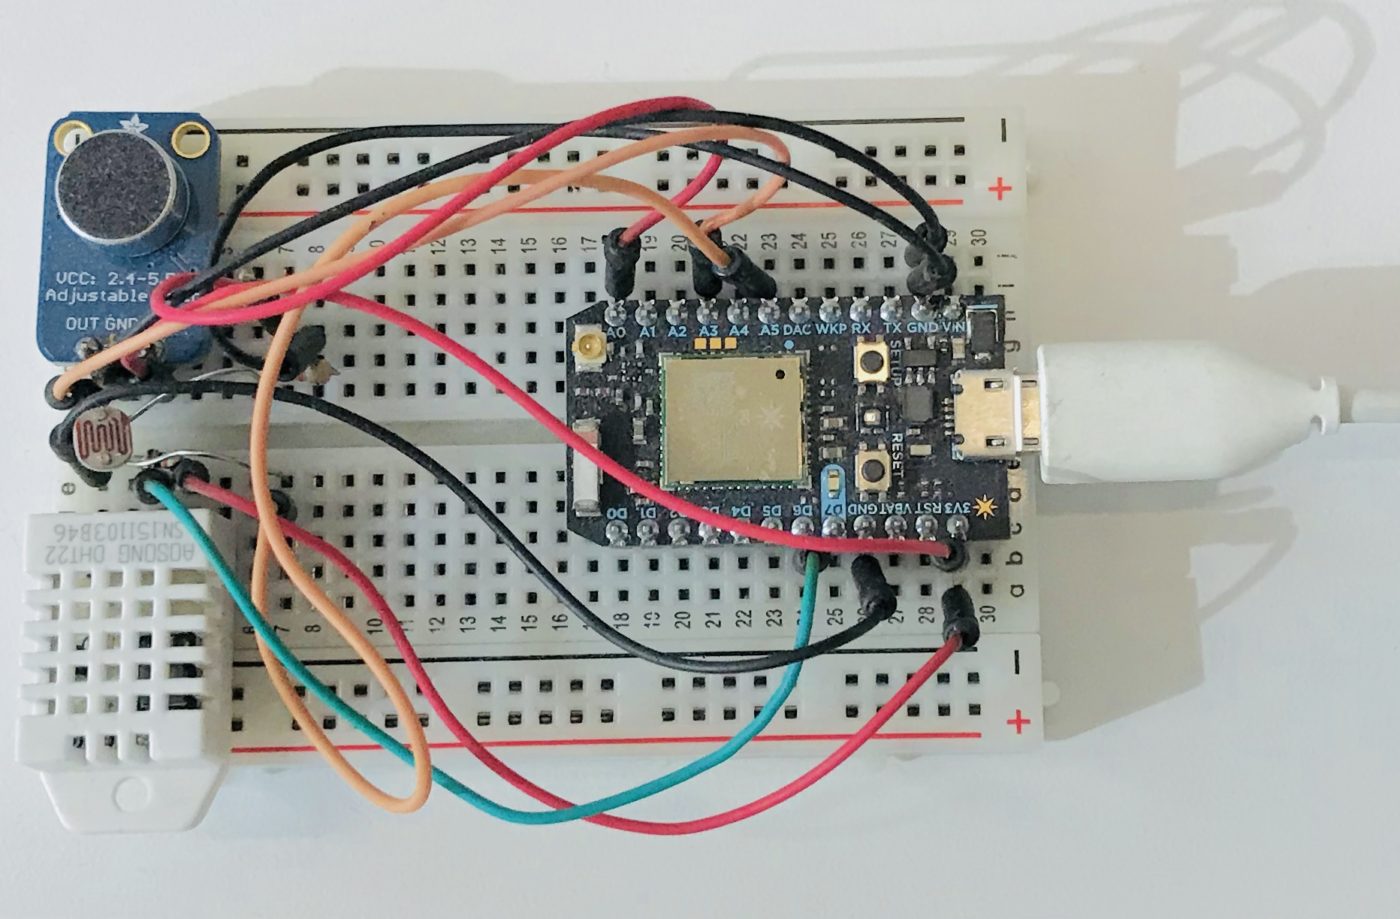
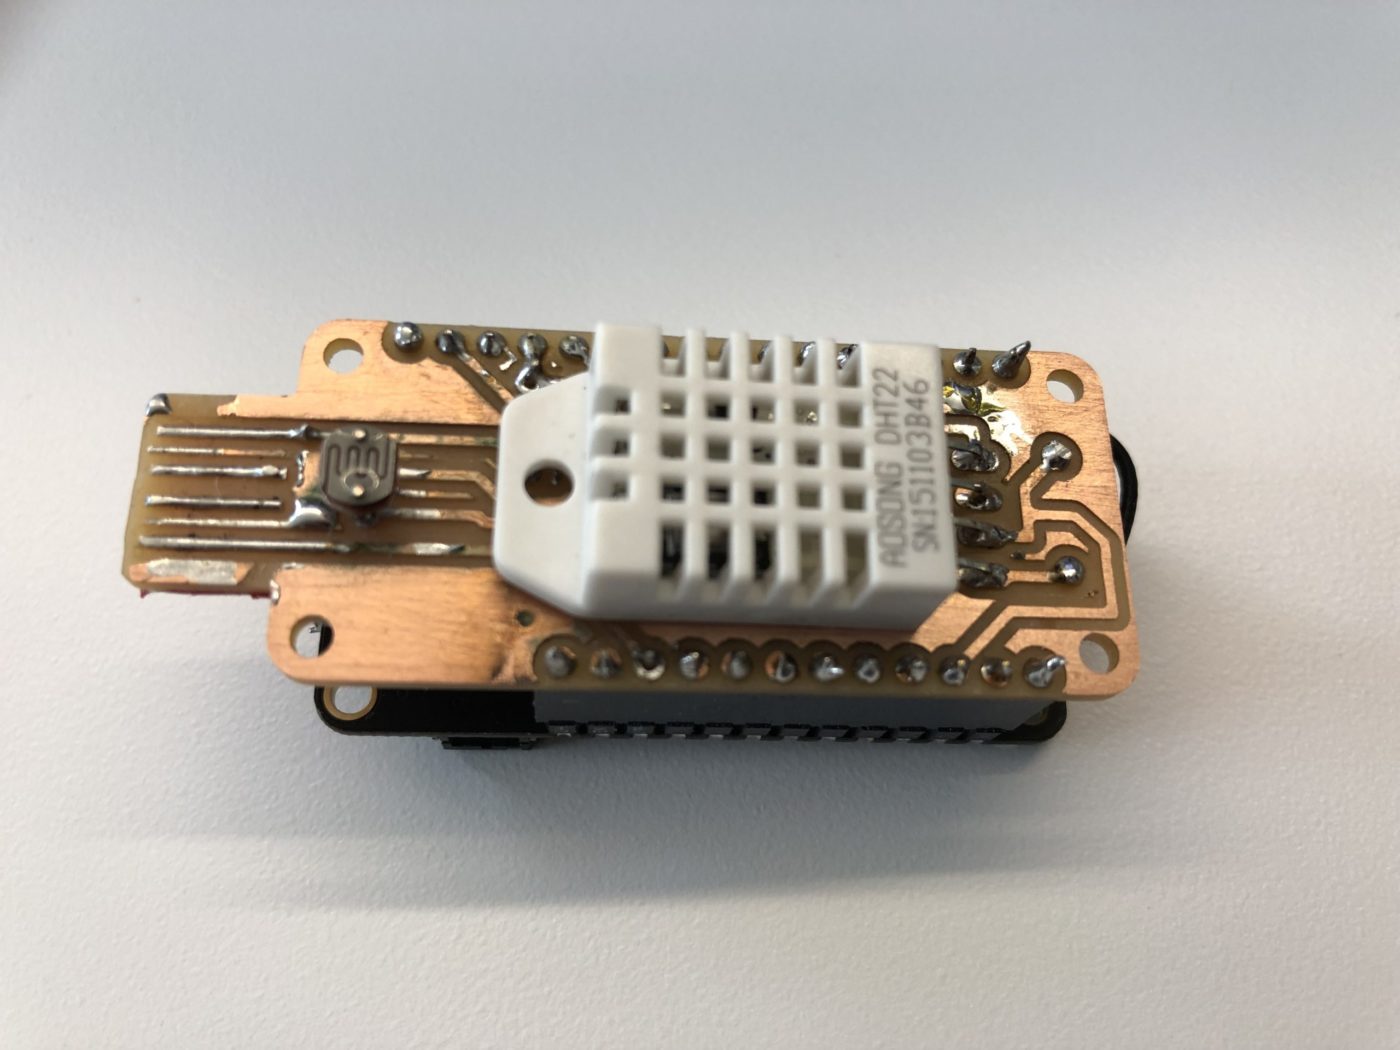
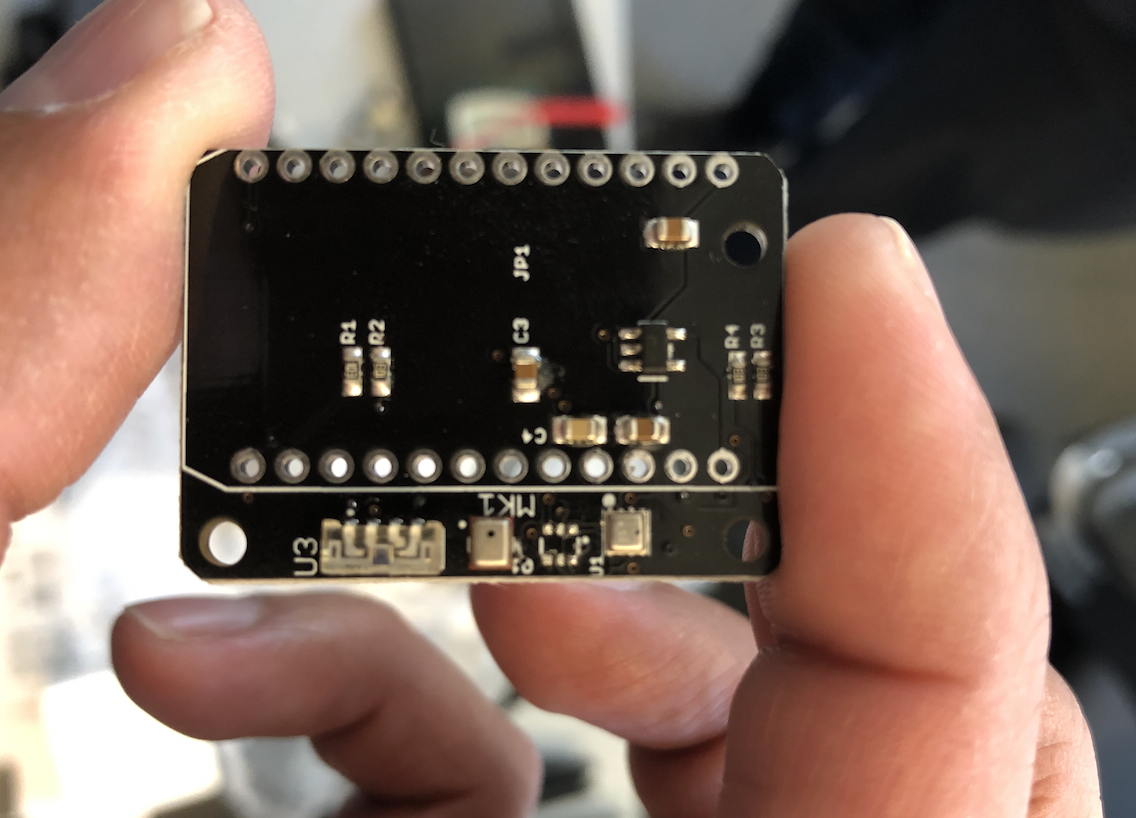
Using sensors for continuous feedback
Another way to generate spatial information in real-time is with the deployment of custom sensors. These sensors are increasingly affordable, can stay connected continuously and stream data at up-to-the-second rates. A device like this can be produced at the size of a matchbox car for under $50 dollars at prototype scale. While this one connects to wifi, there are versions which can utilize 3G cellular networks to bypass all connectivity issues. All that is required is a 5V USB power supply. Sensors on the device provide feedback on sound and light levels, temperature and humidity. Realtime streaming data about environmental conditions is crucial for assessing performance and correlating how spatial conditions affect usage and perception of spaces. The best part of using these devices is that they require no surveys or user interaction, yet provide data which grows in value over time.