
Because it’s visual, it is easy to work through multiple scenarios quickly, and in a way that university planners and leadership can easily understand. Because it’s tied to a GIS system, we can continue to add data to the campus map that helps inform different elements of master planning – like streets, buildings, or vegetation data. Because it’s live, we can plan in real-time. This planning tool is not a report collecting dust on a shelf – it’s dynamic, and can be easily updated as data inputs change. It allows teams to make decisions in real time, track projects, and benchmark against key performance metrics and targets.
Ultimately, we believe the tool can better align learning environments with the delivery of academic programs which, in turn, will help institutions break down traditional silos of ownership to facilitate a culture of sharing university-wide resources.
Features
Building Scorecard
A detailed and auditable scoring system for each building to inform strategic decision making about the future of each property, including:
- Adaptability/Flexibility Scores based on physical attributes including column spacing, ceiling height, and net to gross square footage efficiency.
- Building Condition Scores based on deferred maintenance, systems.
- Accessibility Scores based on the availability of elevators, accessible entries, technology, and restrooms. We capture this information in a scorecard with a summary accessibility score for each building.
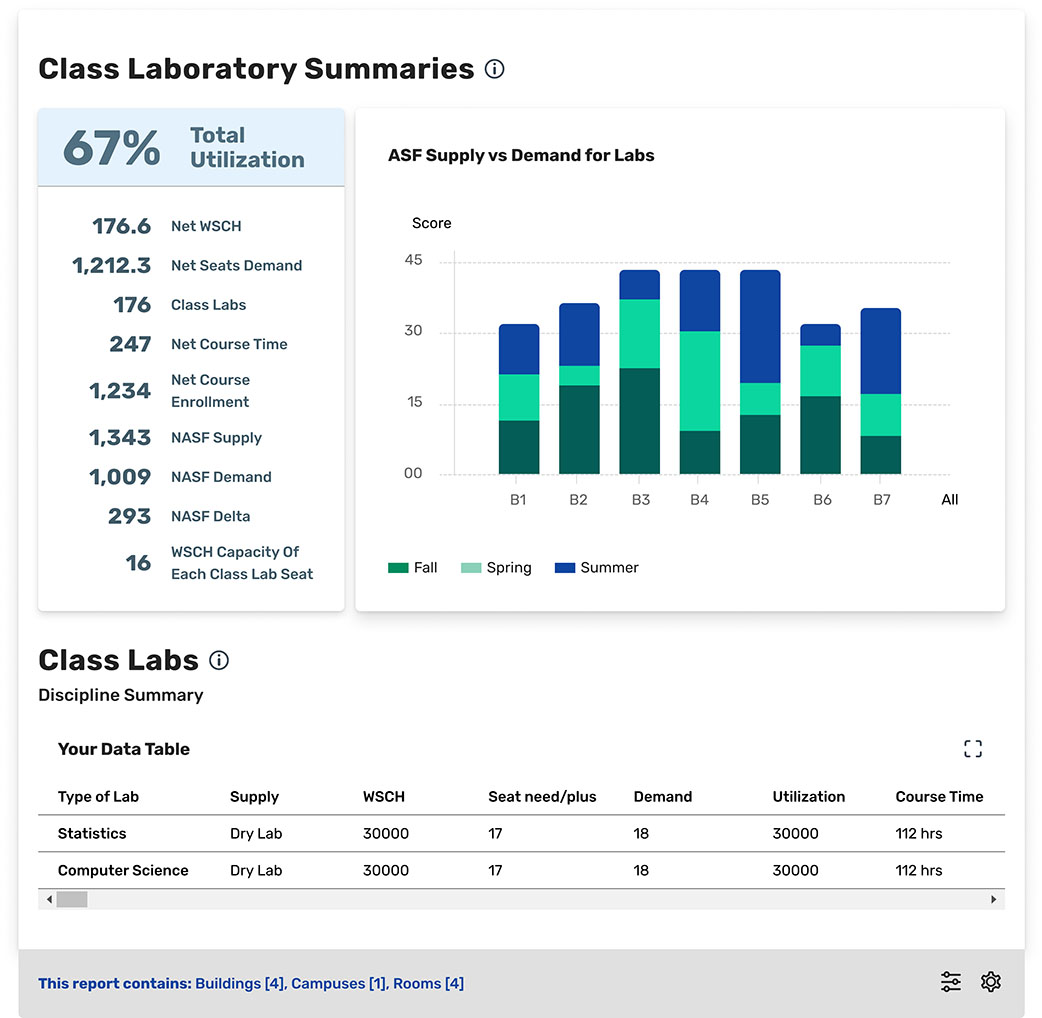
Utilization
Our utilization assessment is based on your room inventory, employee headcounts, enrollment, and course schedule. We evaluate the existing space allocation using the Facilities Inventory Classification Manual (FICM) codes and best practices to evaluate how the existing space allocation compares to the calculated need.
- For instructional space, we evaluate the hourly usage and enrollment in each classroom and teaching lab and compare the usage against the peer benchmarks and State wide standards.
- For research space, we evaluate staffing, research typology, productivity, and funding to establish the estimated space needs.
- For office space, the model calculates the space needs based on established space standards, linked directly to the personnel headcount list, with optional variables to apply hybrid work concepts.
- For study and student life spaces, the model uses planning ratios based on best practices and national standards, with direct inputs on student enrollment, staffing, and other data sources.
Energy and Sustainability
The model can incorporate any available energy usage data on a building-by-building or whole campus level. Scenarios can be generated within the model to show energy reduction based on proposed projects and upgrades.
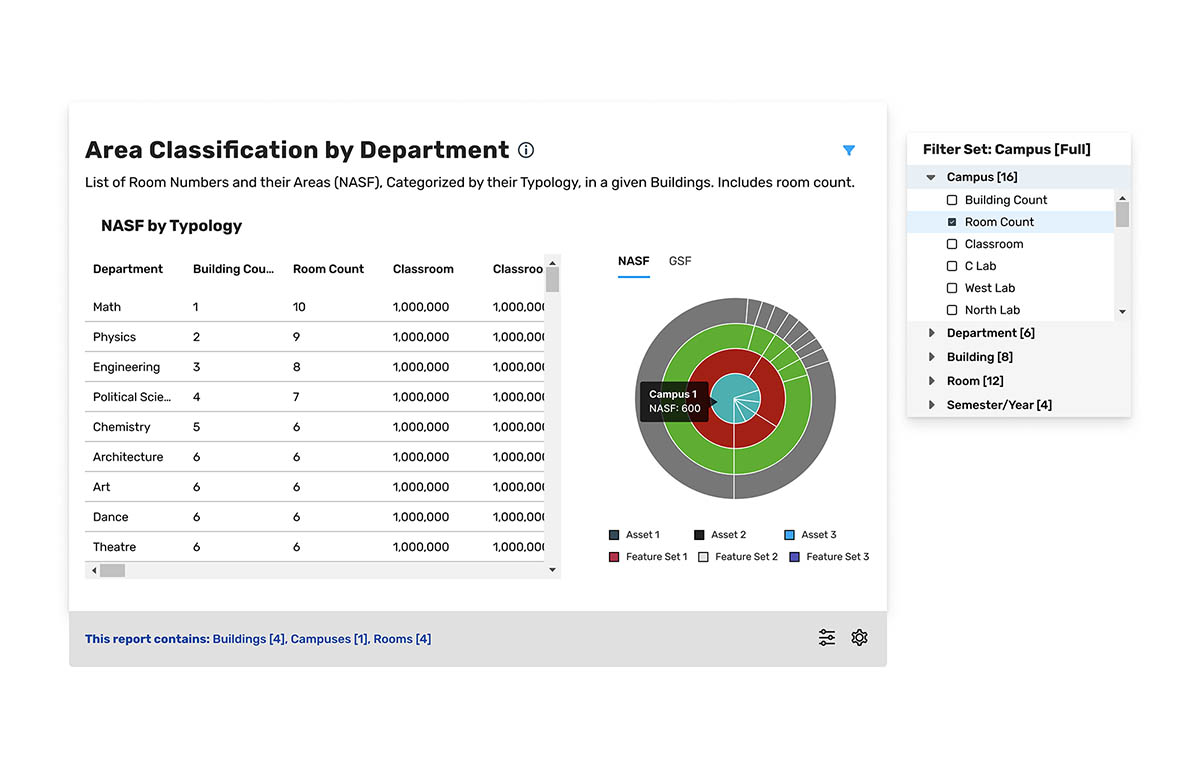
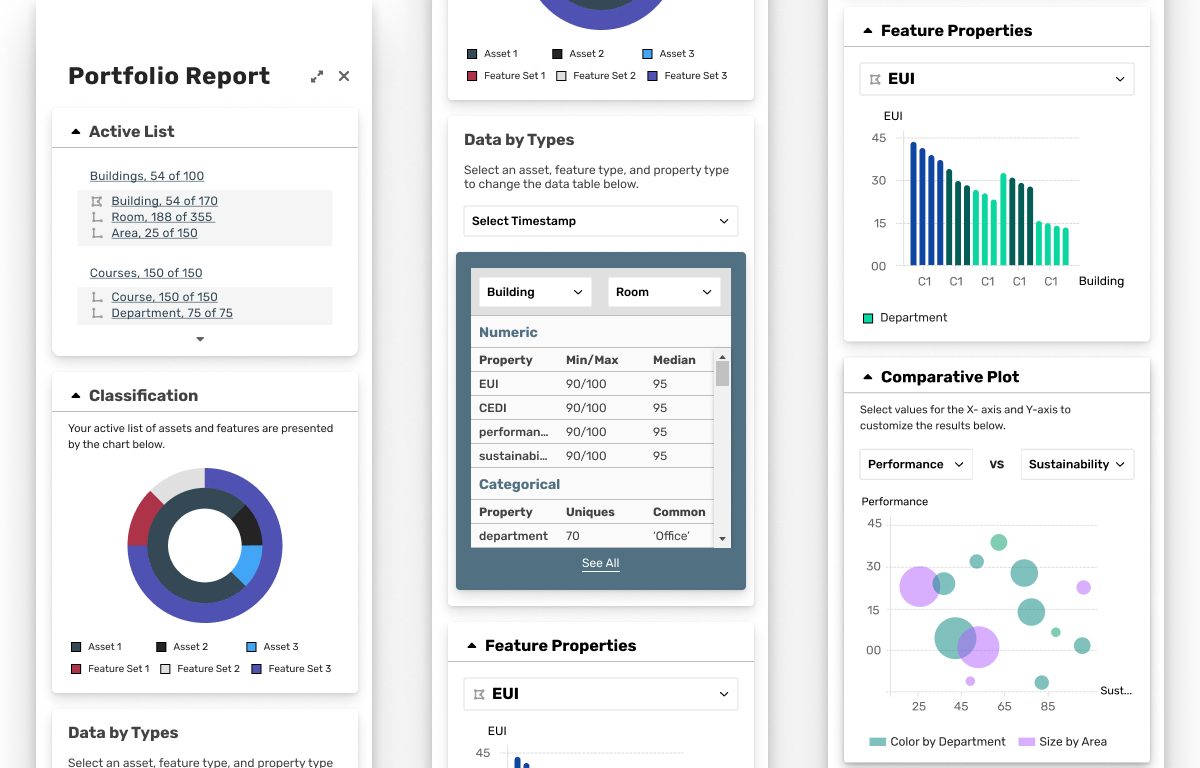
Reporting
Reports are interactive and data can be sorted and filtered by each user, enabling us to clearly see potential opportunities or issues that can lead to impactful solutions. Reports can be created and visualized using our own custom app or using off-the-shelf business intelligence software such as Power BI. Data models can be delivered in Excel, Power BI, or other platforms as needed. Regardless of the platform selected, all formulas and modeling will be shared in an open-book model so you and all stakeholders can see how each metric works and manipulate variables as needed.
Hosting
We have the capability to provide either a hosted solution on our network using data exported from your systems, or to work entirely within your network connecting directly to your centralized data repository. There are benefits and challenges associated with either approach, and we will work with you to identify the best solution given your internal resources and operational protocols. The data models we create are unique to each institution. The data model, and training on how to update it, can be provided for your use as part of the master plan deliverable. The final product will be a living master plan that you can continue to use long after the final master plan report is published.
Tech-Stack
- React
- Redux Toolkit
- AWS Amplify
- Next.js
- Deck.gl
- Nebula.js
- React-map-gl
- Recharts
- Turf.js
- Ant Design
- Lottie
Team
- Thomas Kearns, Digital Innovation Strategist
- Alek Shnayder, Software Engineer
- Chan Youn, Software Engineer
- Aprameya Pandit, Data Scientist
- Brad Rogers, P+S Senior Consultant
- Ellen Berglund, UX Designer
- Elizabeth Michals, Senior UX/UI Designer
- Anshika Saxena, UX Designer